IAM Rate Features: From Logging a Task to Sending a Clean Work Report
Sooner or later, someone asks what you did. A client wants a weekly update. Your manager asks what you worked on this month. Or you want to know how many hours you really studied. If you didn't write it down, you have to guess.
We built IAM Rate, also called Daily Task Tracker, for that moment. You log each task when you finish it and add a short note if you want. The app turns it all into a text log, charts and a CSV file. When the report is due, most of the work is already done.
If you're comparing task trackers, you may have noticed that many ask a lot before they give anything back. You set up projects, clients and tags, then remember to start and stop a timer all day. IAM Rate has none of that.
Below, we go through each feature in the order you'd use it, from planning your day to sending a clean report. If you're short on time, the summary at the end lists what stands out.
Plan your day with an auto-saving to-do list
Most good days start with a plan. The To-Do List box is a simple place to write yours. It saves automatically as you type, so there's no Save button to forget.
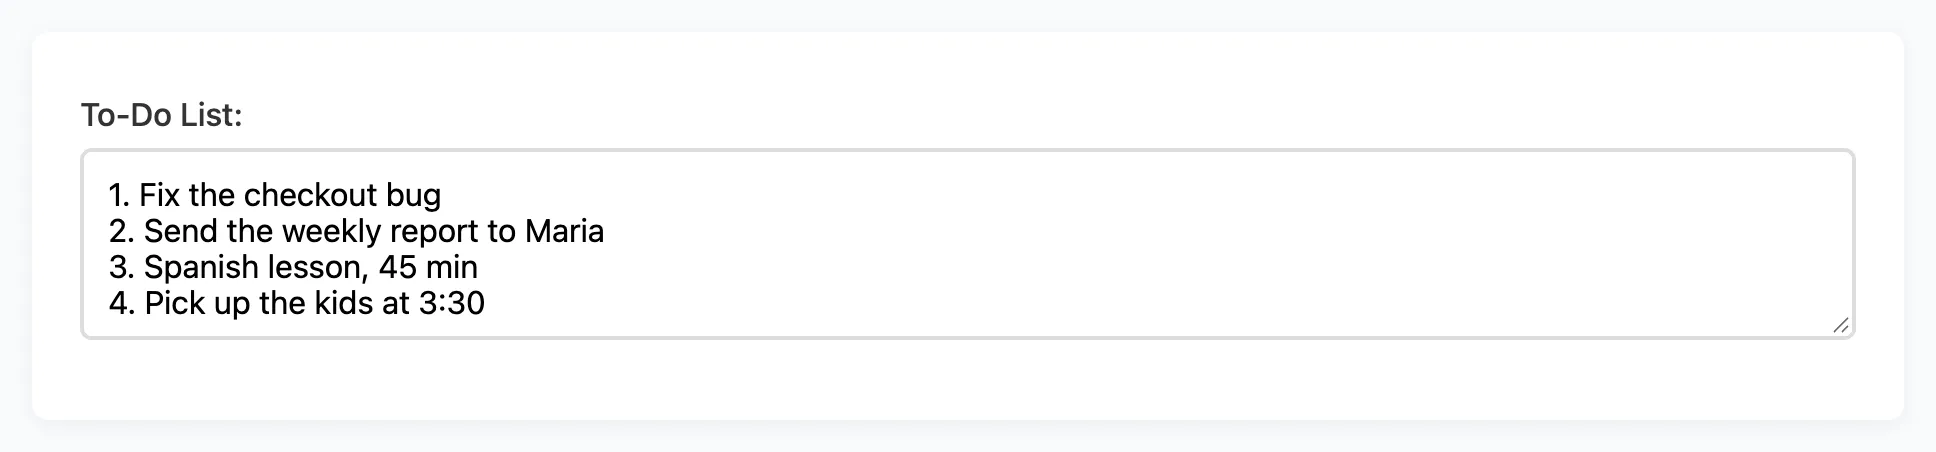
Your plan sits on the same page as your time log. You don't have to hold the list in your head, and when you finish an item, you log it right there. For tips on writing a better list, read how to build a daily to-do list that actually works.
Log a task in a few seconds
When you finish a task, you add it with one short form:
- Type the task name. A dropdown suggests names you've logged before.
- Pick a date. It's set to today, but you can choose a past day.
- Enter the hours and minutes it took.
- Pick a category: Work, Personal, Family or School.
- Click Add Task.
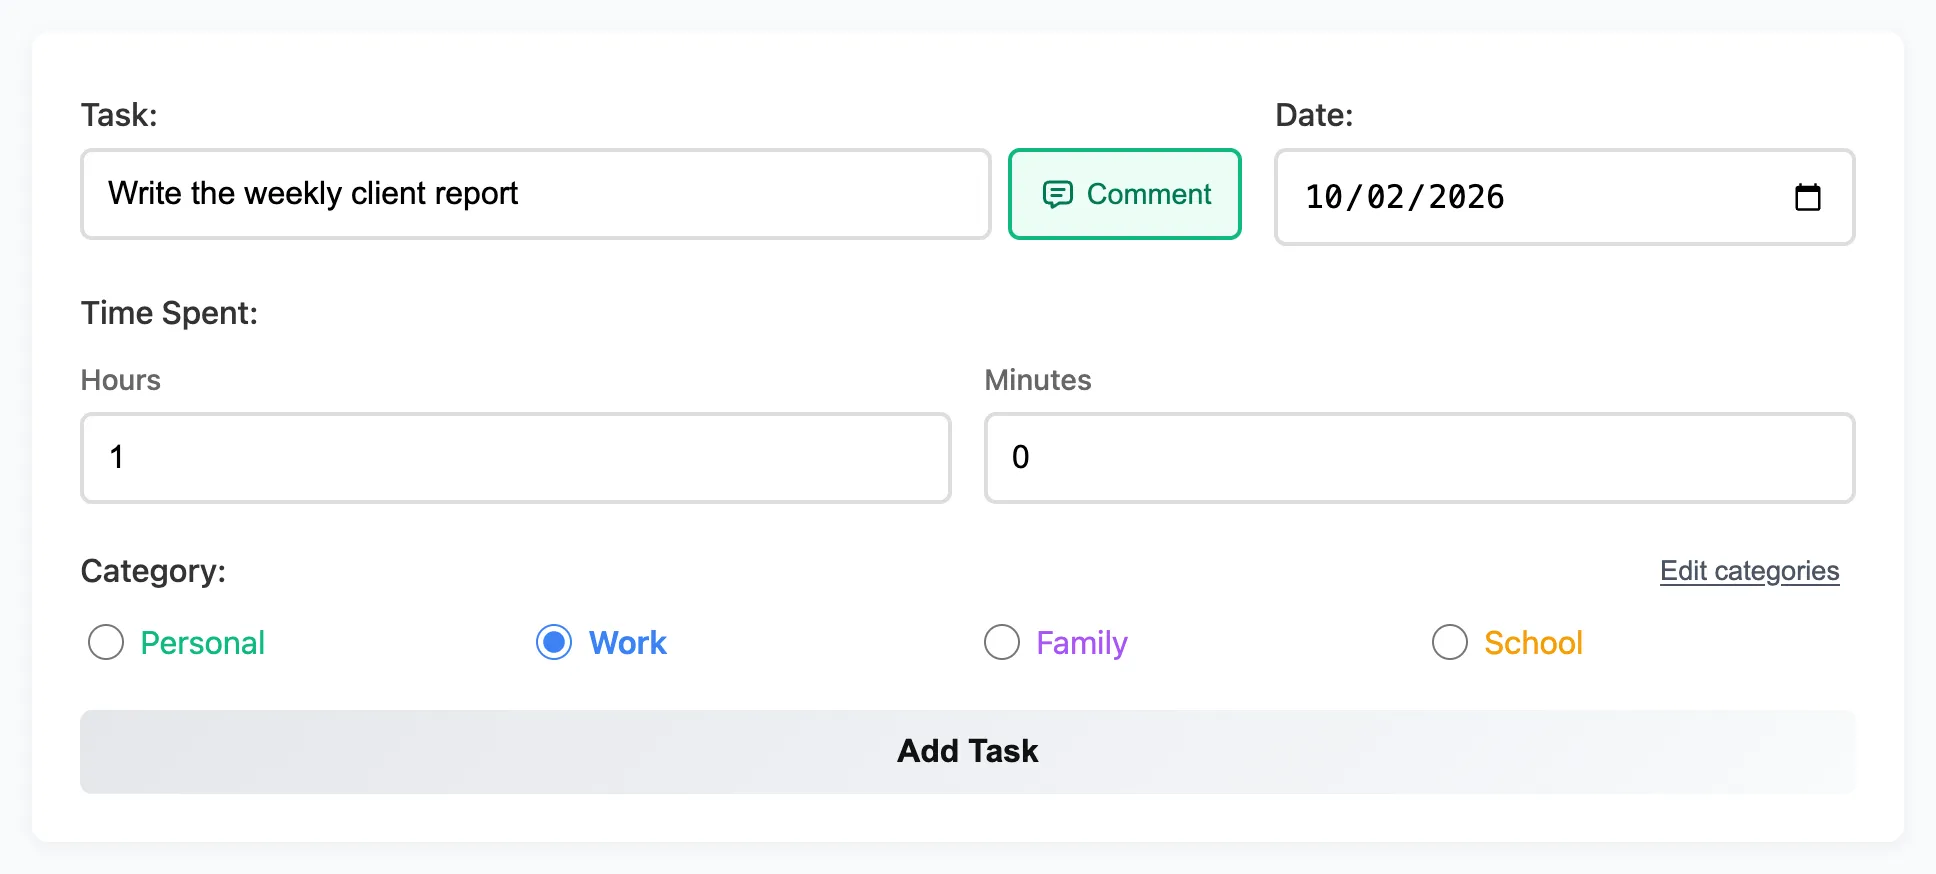
There's no timer to start or stop, so you never come back to a clock that ran all through lunch. You enter the time when the task is done.
There's nothing to set up first, either. You pick one of four categories and move on. The name suggestions save typing, and they help you use the same name for the same work.
Logging past dates helps more than you'd think. Say you were in meetings all afternoon and forgot to log them. The next morning, pick yesterday's date and add the hours there. Your record stays complete.
The comment button: your memory on report day
If you write work reports, this is the feature we'd point to first. People forget what they did. By Friday, Monday is a blur. By the end of the month, most of the details are gone.
The Comment button sits right next to the Task box. Click it, and a small pop-up opens where you type a note about the task. You get up to 500 characters, and a live counter shows how many you've used.
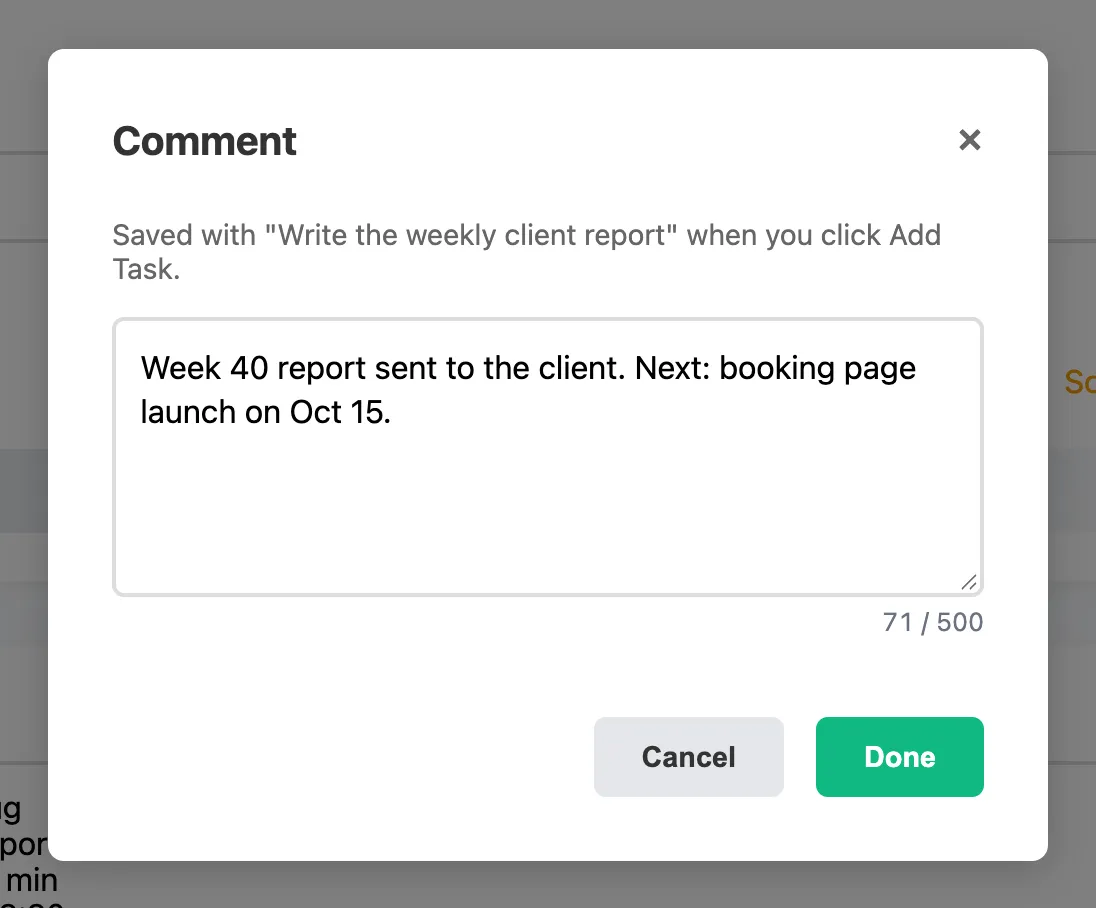
Click Done to close the pop-up. When you click Add Task, the note is saved with the task. The button turns green while a note is attached, so you know it's there.
Tasks with a note show a small speech bubble in the task table. Hover over it to read the note. Click it, and the task opens in the Edit Task dialog with the note ready to change. You can also add a note to any task later with its Edit button. Notes go into the CSV file too, in their own Comment column.
A task name like "Client report" tells you how long something took. The note tells you what happened and what comes next. A line like "Week 40 report sent to the client. Next: booking page launch on Oct 15." is ready to paste into an update.
Tip: Write the note right after you finish the task, while it's fresh. One sentence is enough. At the end of the month, those sentences become your report.
Custom categories that match your work
Every task goes into one of four categories: Work, Personal, Family or School. Each one has its own color, and that color follows the task into the charts.
If those names don't fit, click Edit categories and rename them. Each name can be up to 20 characters, and each keeps its color. A freelancer might use a client's name. Someone with a second job might use Side Project.
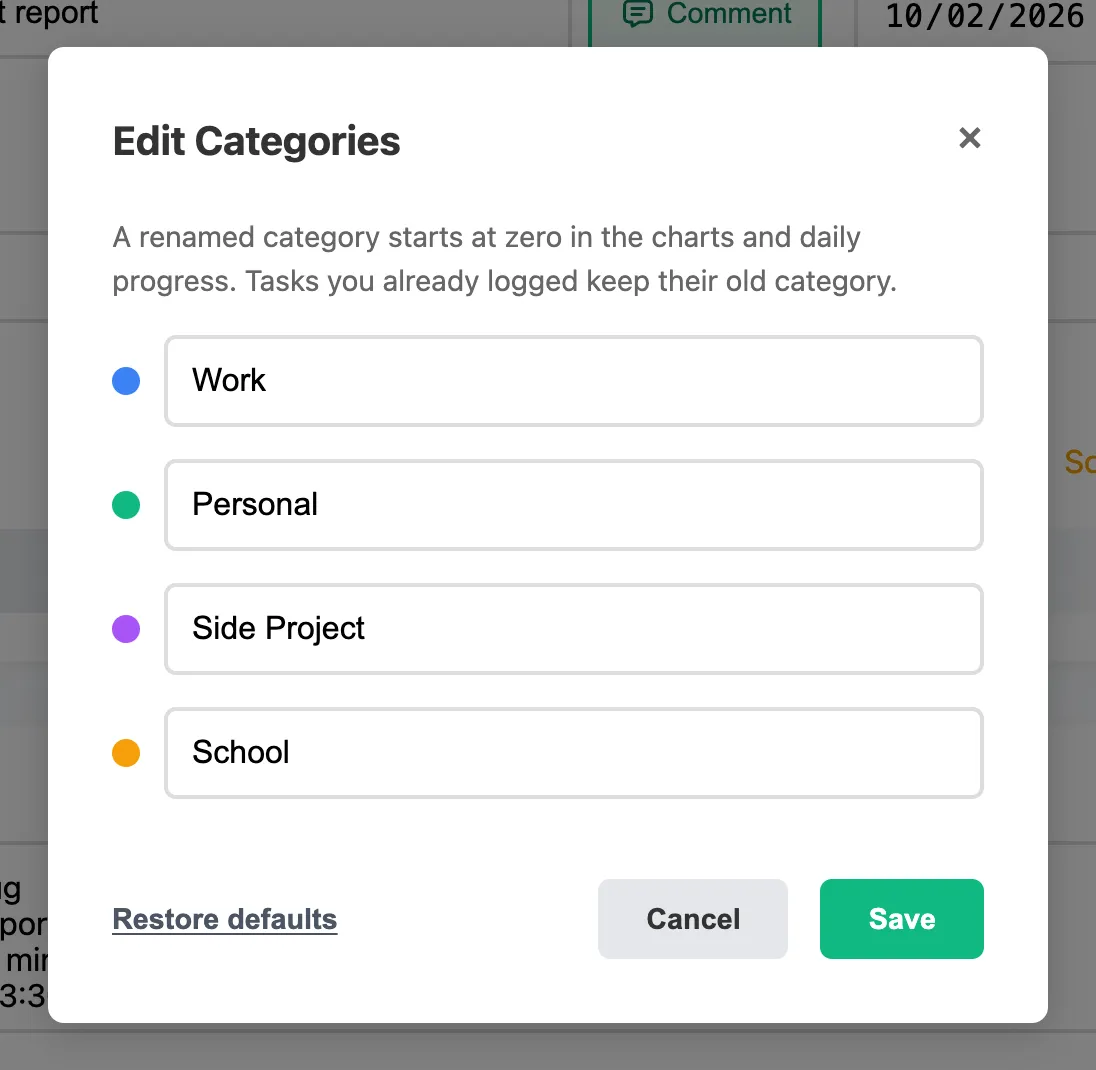
One thing to know: a renamed category starts at zero in the Time Report and on the rabbit cards. Tasks you already logged keep their old category name. They stay in your text log, task table and CSV, but they no longer count in the Time Report.
So it's best to rename categories before you start logging, not halfway through a month you need to report on. If you change your mind, the Restore defaults button brings back the original names.
Rabbit progress cards that make you want to finish the day
The app shows one daily progress card for each category. Each card has a rabbit on a track with a carrot at the end. As you log time today, the rabbit runs toward the carrot.
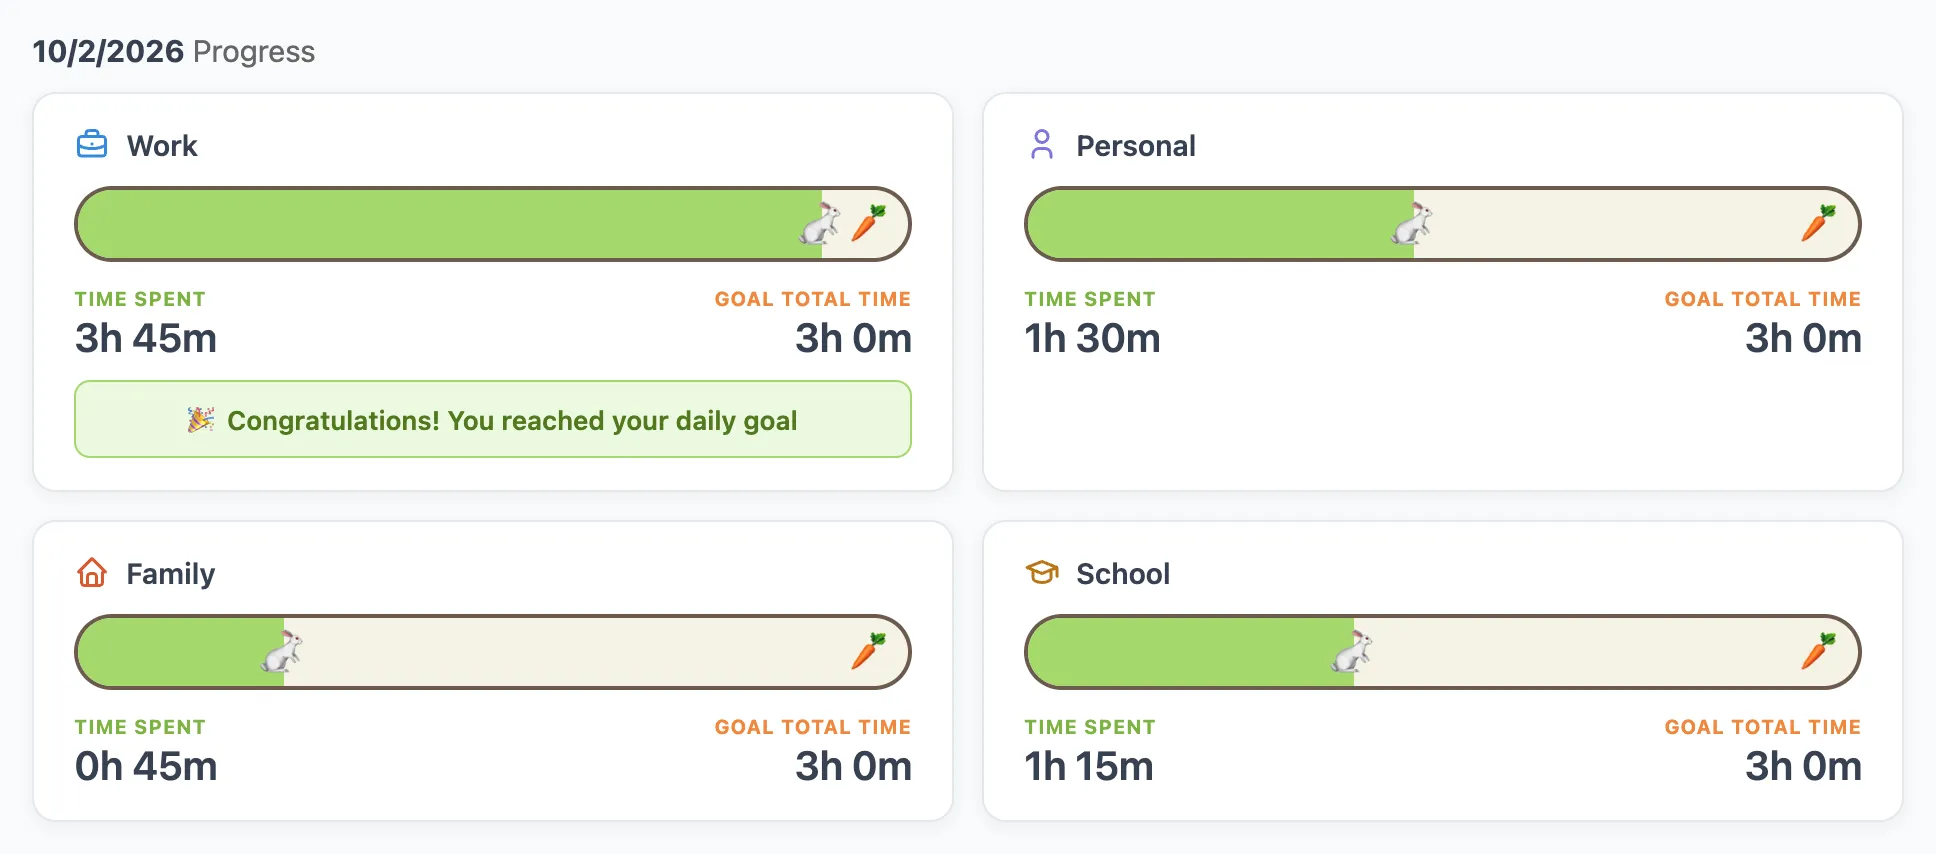
The daily goal is 3 hours per category. When you reach it, the card congratulates you for reaching your daily goal. It's a small thing, but it turns your day into a little race you want to finish.
A rabbit stuck halfway to its carrot is hard to ignore. On a slow afternoon, it gives you a reason to finish one more task. And when the Family rabbit hasn't moved, it nudges you to make time for the people at home.
For help with putting things off, read how to stop procrastinating.
Edit tasks for a cleaner report
Logs get messy. You type "clinet call" once and "Client call" the next day. You enter 2 hours when it was 20 minutes, or put a task on the wrong date. Small mistakes like these split your totals and make a report look careless.
Every task in the table has an Edit button. The Edit Task dialog lets you change the category, task name, hours, minutes, date and comment. Each task also has a Delete button, and it asks you to confirm first, so you don't lose a task by accident.
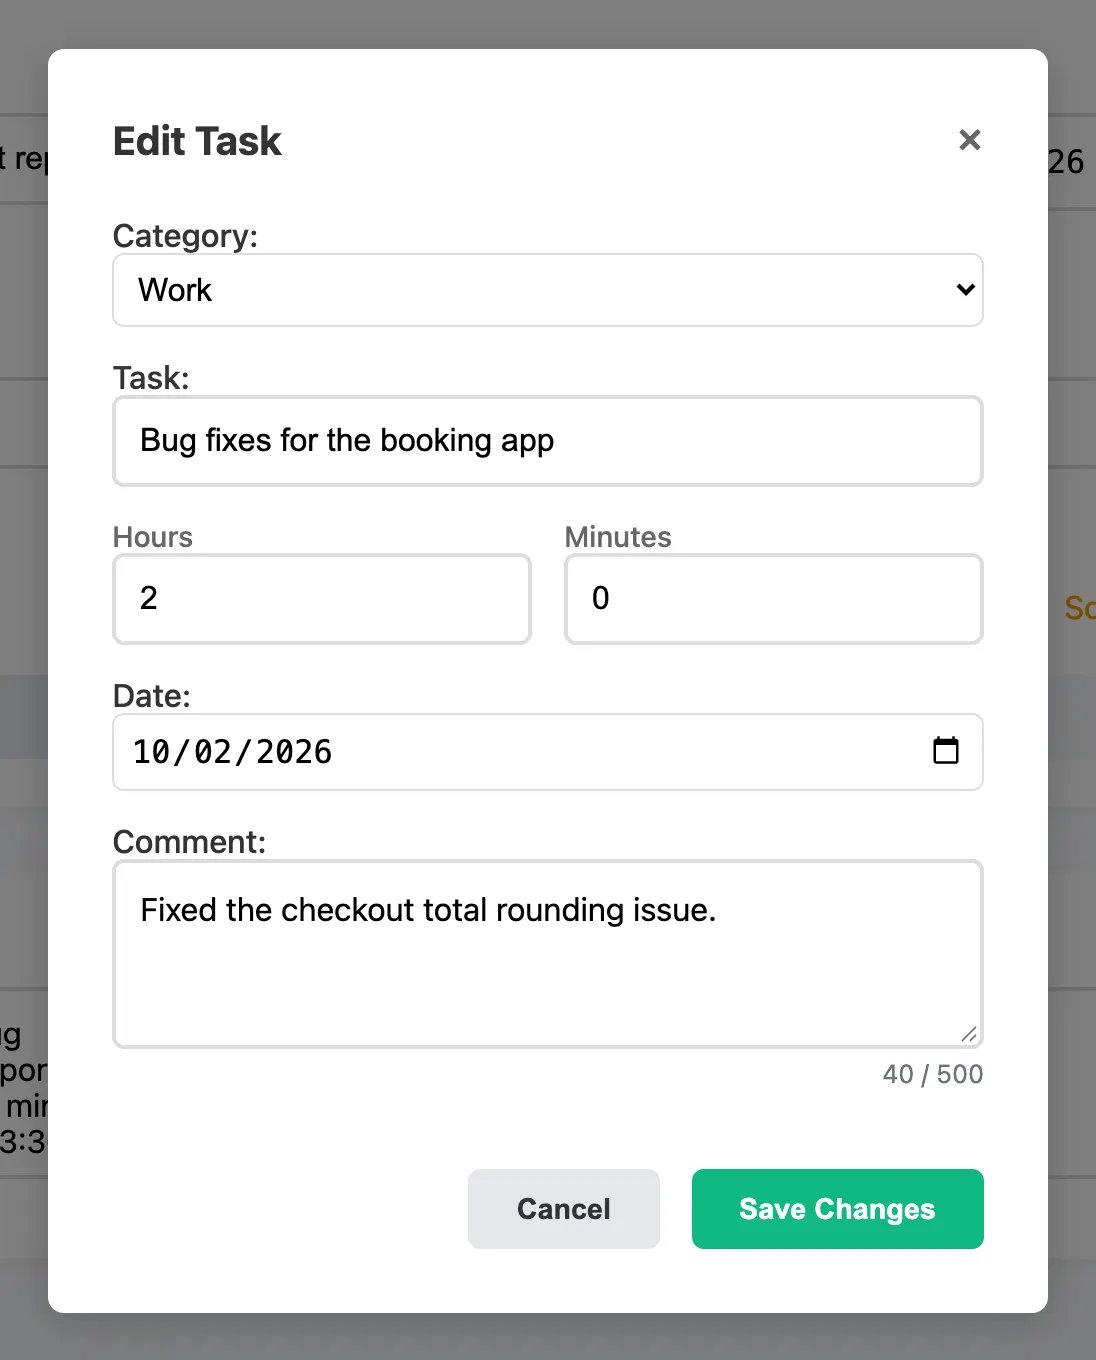
Fixing names matters most. If you call a job "Weekly report" one day and "weekly rpt" the next, they show up as two different tasks. Edit each "weekly rpt" task to match, and they line up as one task in the text log, the charts and the CSV.
Correct wrong times, dates and categories too, and your totals will be right. A few minutes of cleanup on Friday gives you a report you can trust and send as it is.
Recorded Tasks: your finished work in plain text
The Recorded Tasks box shows everything you've logged as plain text. It's grouped by date, then by category. Each day shows its total time, and so does each category. The newest day is at the bottom.
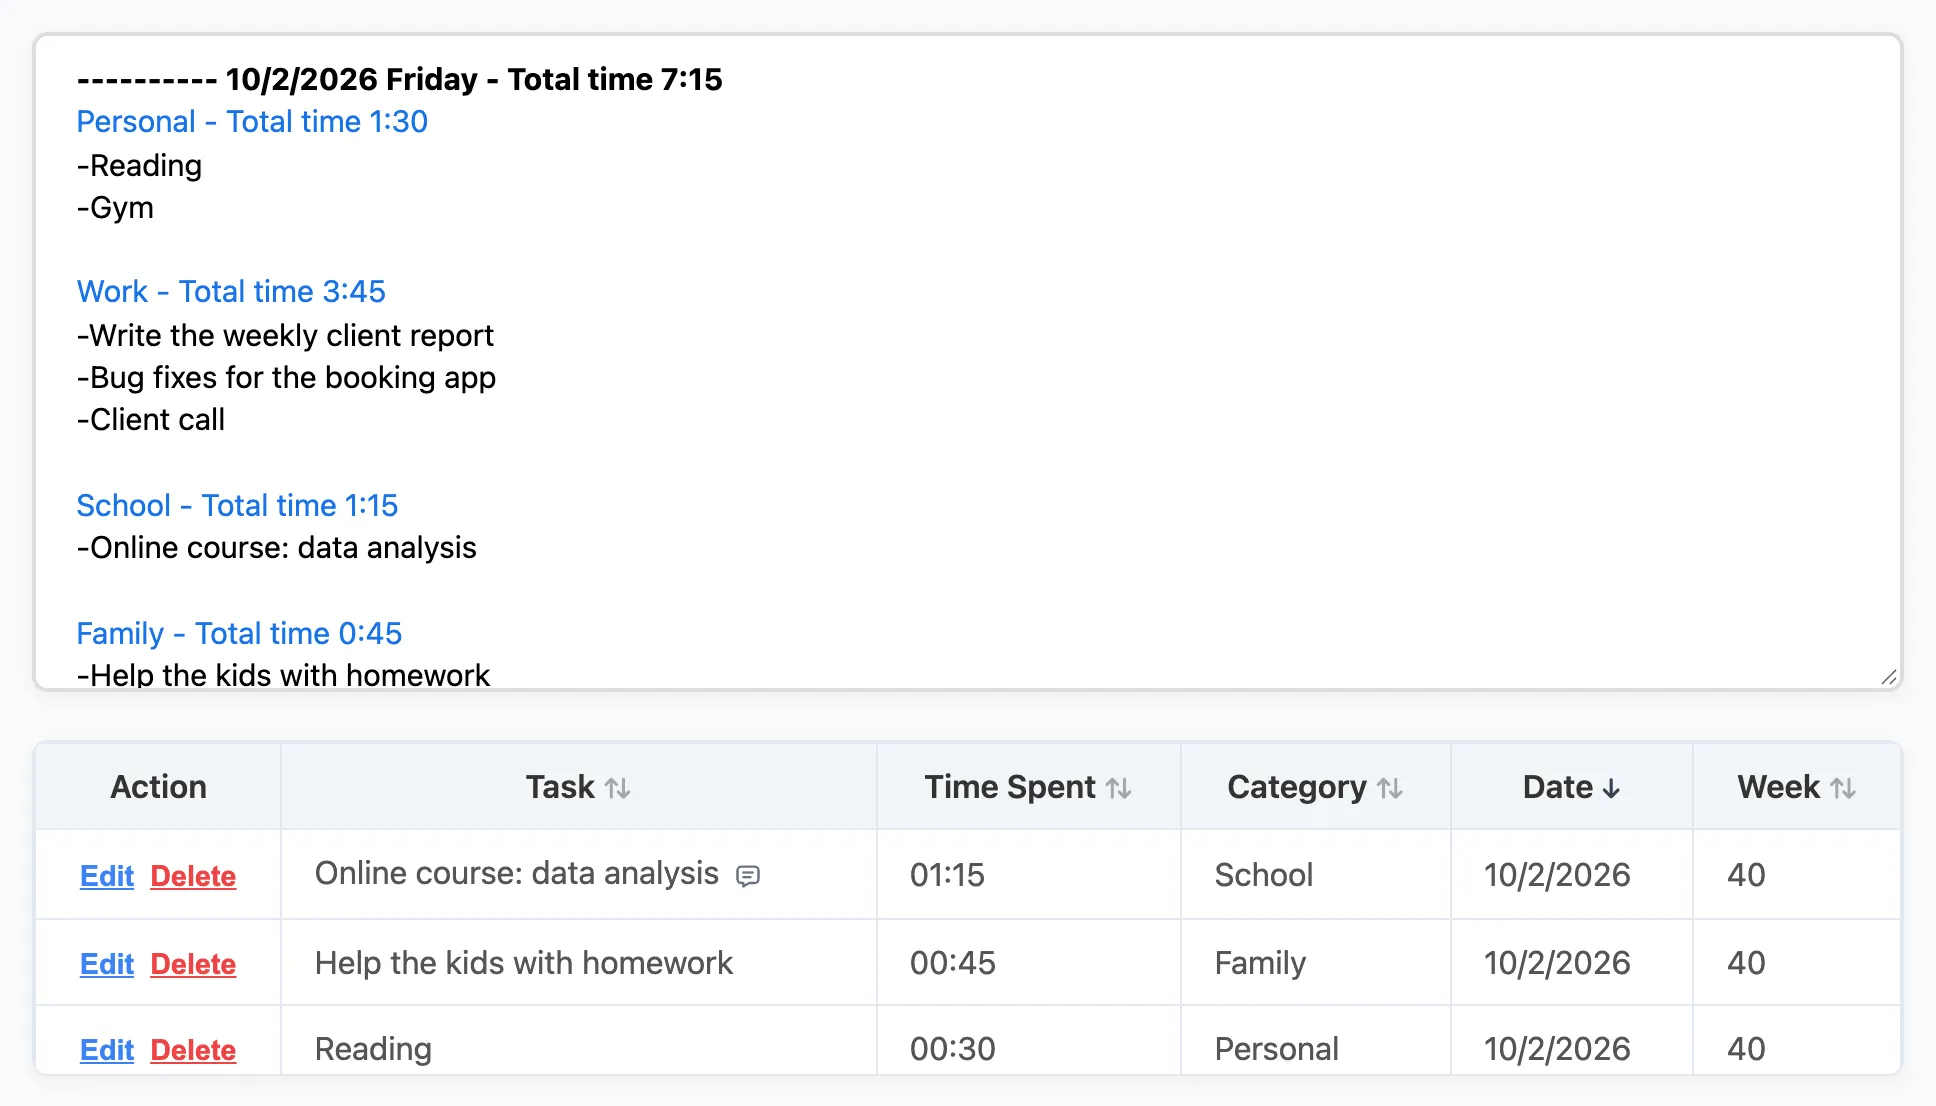
Plain text sounds basic, but it's the easiest format to reuse. Copy a day or a whole week and paste it into an email, a chat message or a report. There's no formatting to fix and no screenshot to crop.
Below the text log is the task table. Click a column header to sort by task, time spent, category, date or week. The Week column is the week number of the year, which helps if your team plans in weeks.
Time Report charts that show where your time went
A chart shows the shape of your week in one look. You can spot a lopsided week before the whole month ends up that way.
The Time Report dashboard has a Today, Week and Month toggle. Month is selected when you open it. Summary tiles at the top show your total time and the time for each category.
Week view
The Week view shows a stacked bar for each day of the current week, split by category. You can see right away which days went to work and which went to family or school.
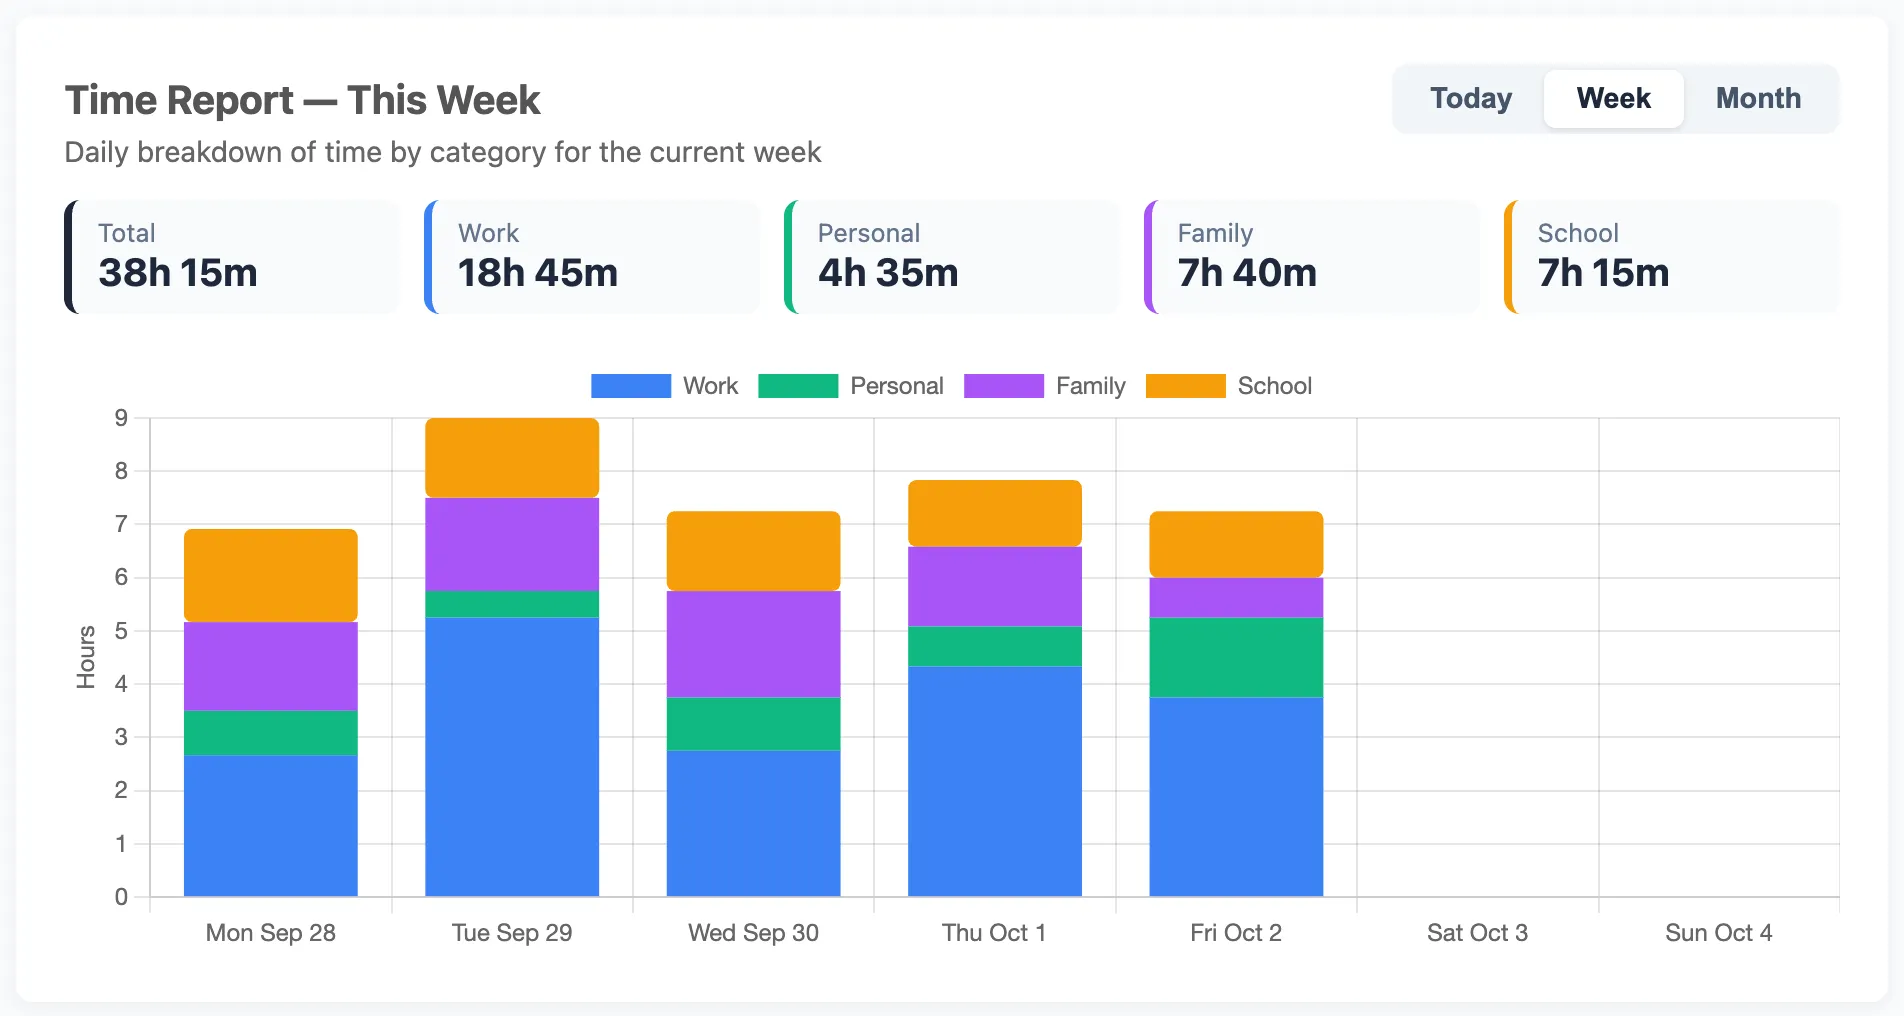
The tiles are handy for reports. In this example, the week adds up to 38h 15m, with 18h 45m on Work. That's the kind of number a manager or client wants to see.
Month view
The Month view shows the current month week by week, so you can compare one week with the next. It helps with a monthly report, and it shows you any week that got away from you.
Today view
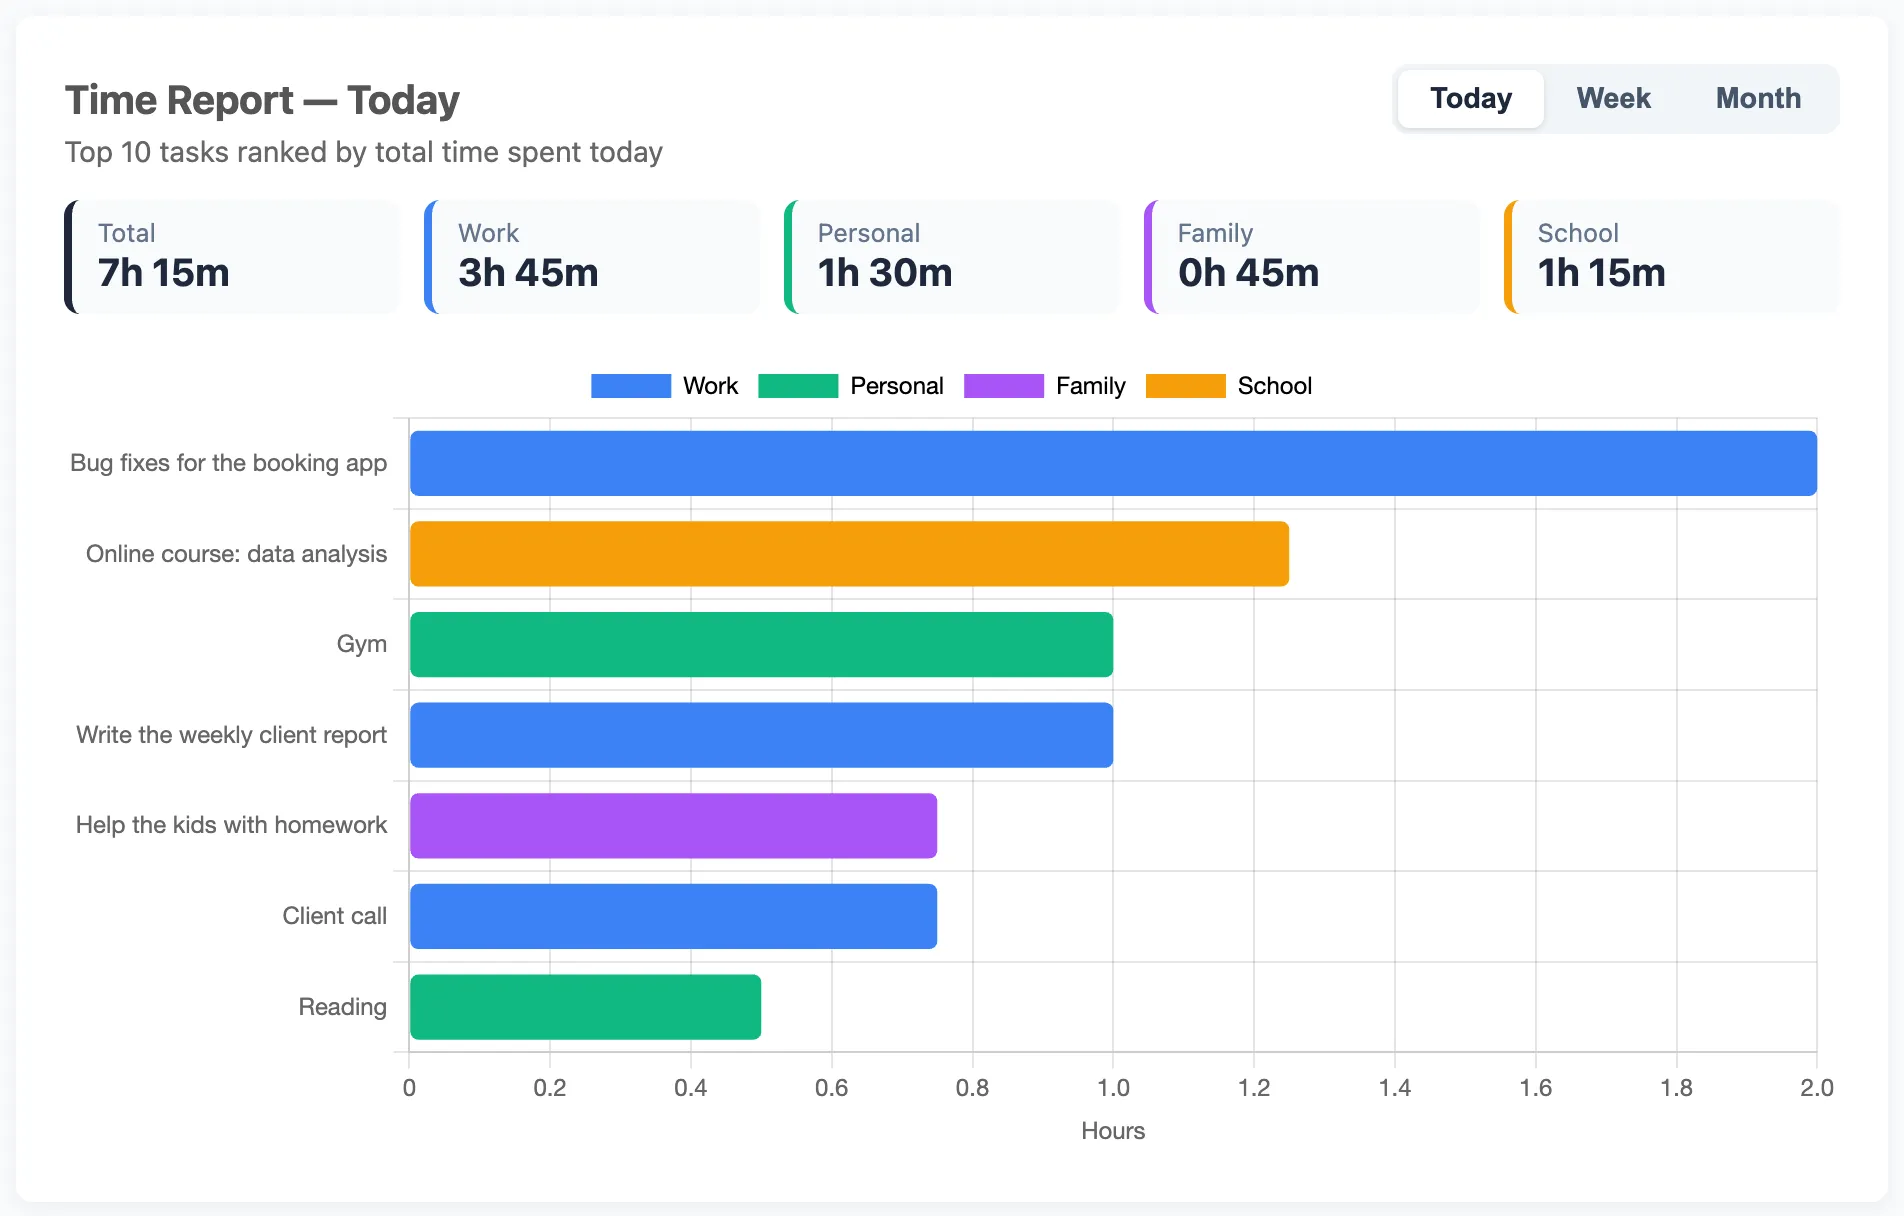
Today shows your top 10 tasks of the day, ranked by time and colored by category. It's a quick check on where today really went before you close the laptop.
Total time spent: a clear sign your time was useful
The Cumulative Time Spent chart shows one big number: the hours you logged in the period you pick. You can choose 7D, 1M, 6M, YTD, 1Y or Max. Under the number, a line climbs from zero as your hours add up.
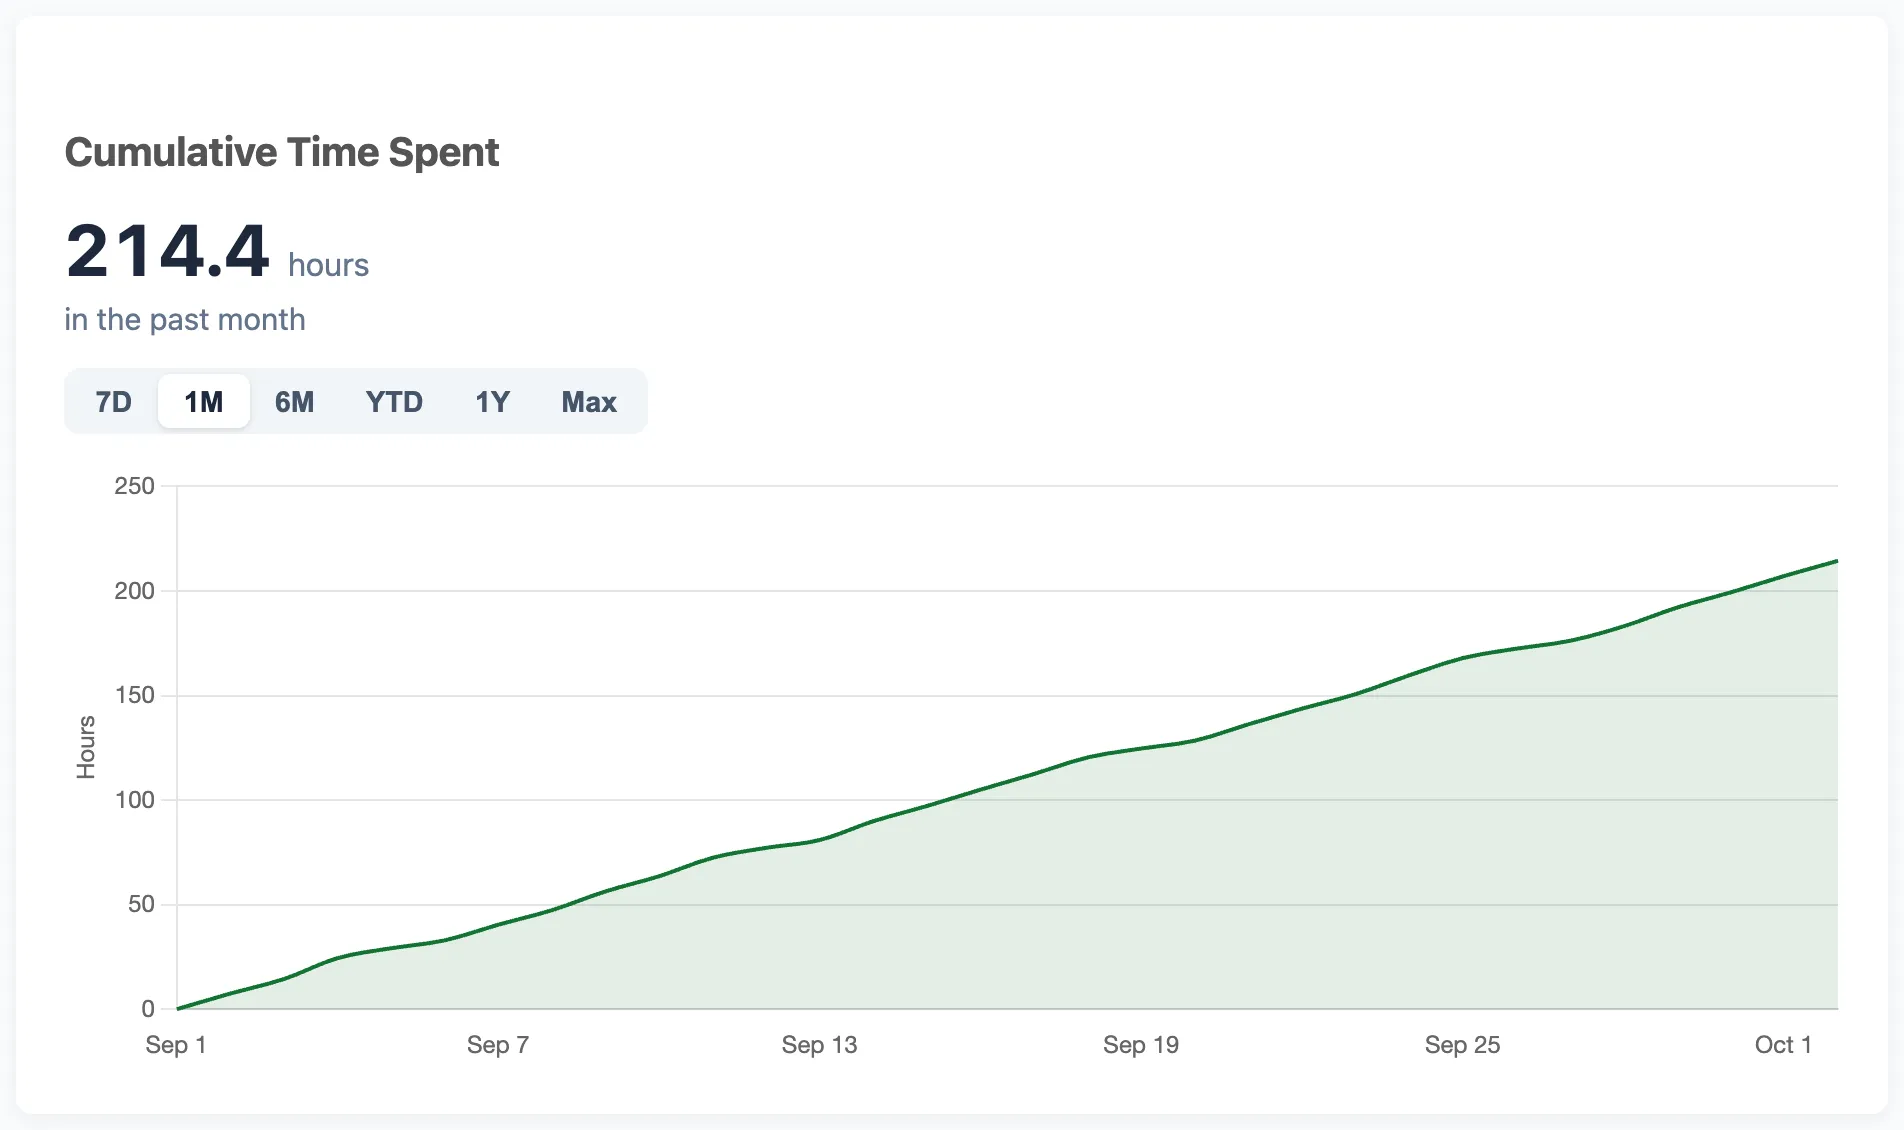
Hover over any day to see your running total for the period up to that day. A to-do list shows what's left. This chart shows the work you've already done.
Some days you feel you got nothing done. Then you see 214 hours in the past month, and you know your time went somewhere useful. On a slow week, that growing number reminds you the work is adding up. We wrote more about this in why tracking your time makes you more productive.
Task Frequency: your habits at a glance
The Task Frequency cloud shows your 30 most repeated tasks of all time. The more often you log a task, the bigger and darker it looks.
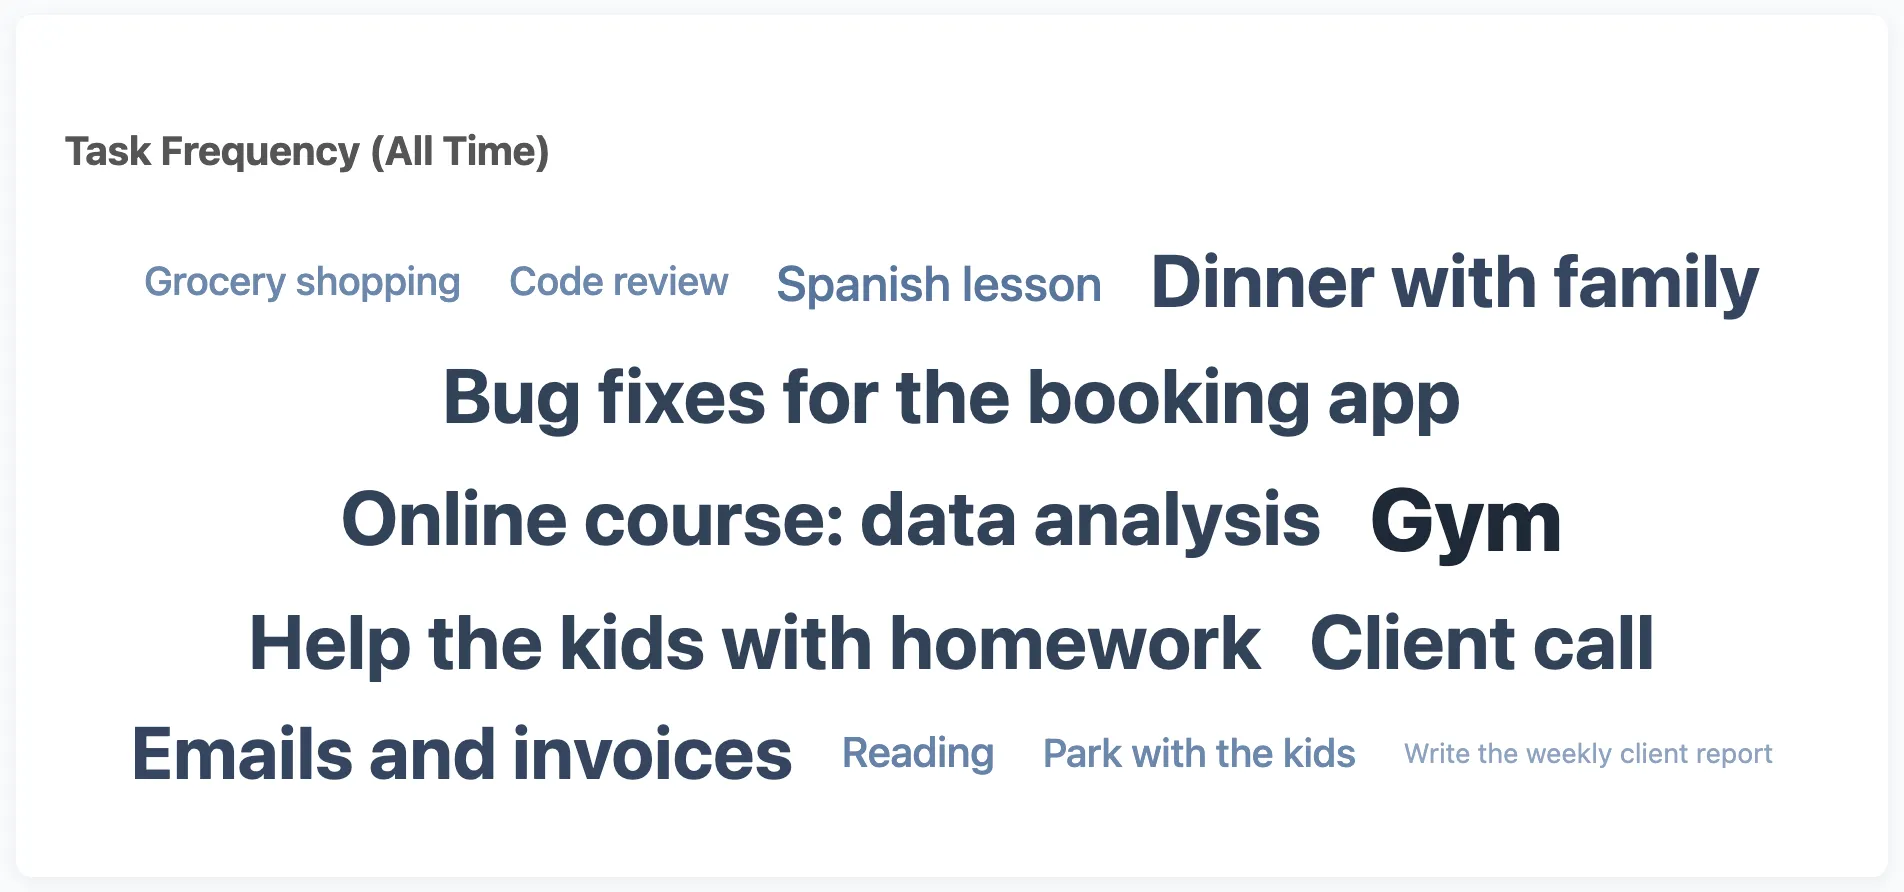
It gives you a quick look at your habits. If "Email" is the biggest word on the screen, that tells you something. If "Exercise" is tiny, that tells you something too. It's good to know when you plan next week.
Download a CSV and sort by category
The Download CSV button gives you a file with every task you've logged. It has six columns: Category, Task, Time Spent, Date, Week and Comment. Category values are lowercase, like work or personal.
Open the file in Excel, Google Sheets or Numbers, and you can:
- Sort by category to put all your work tasks together.
- Filter by week or date to pull out one week or one month.
- Add totals for each category or each week.
- Read your comments next to each task, then send the sheet to a manager or client.
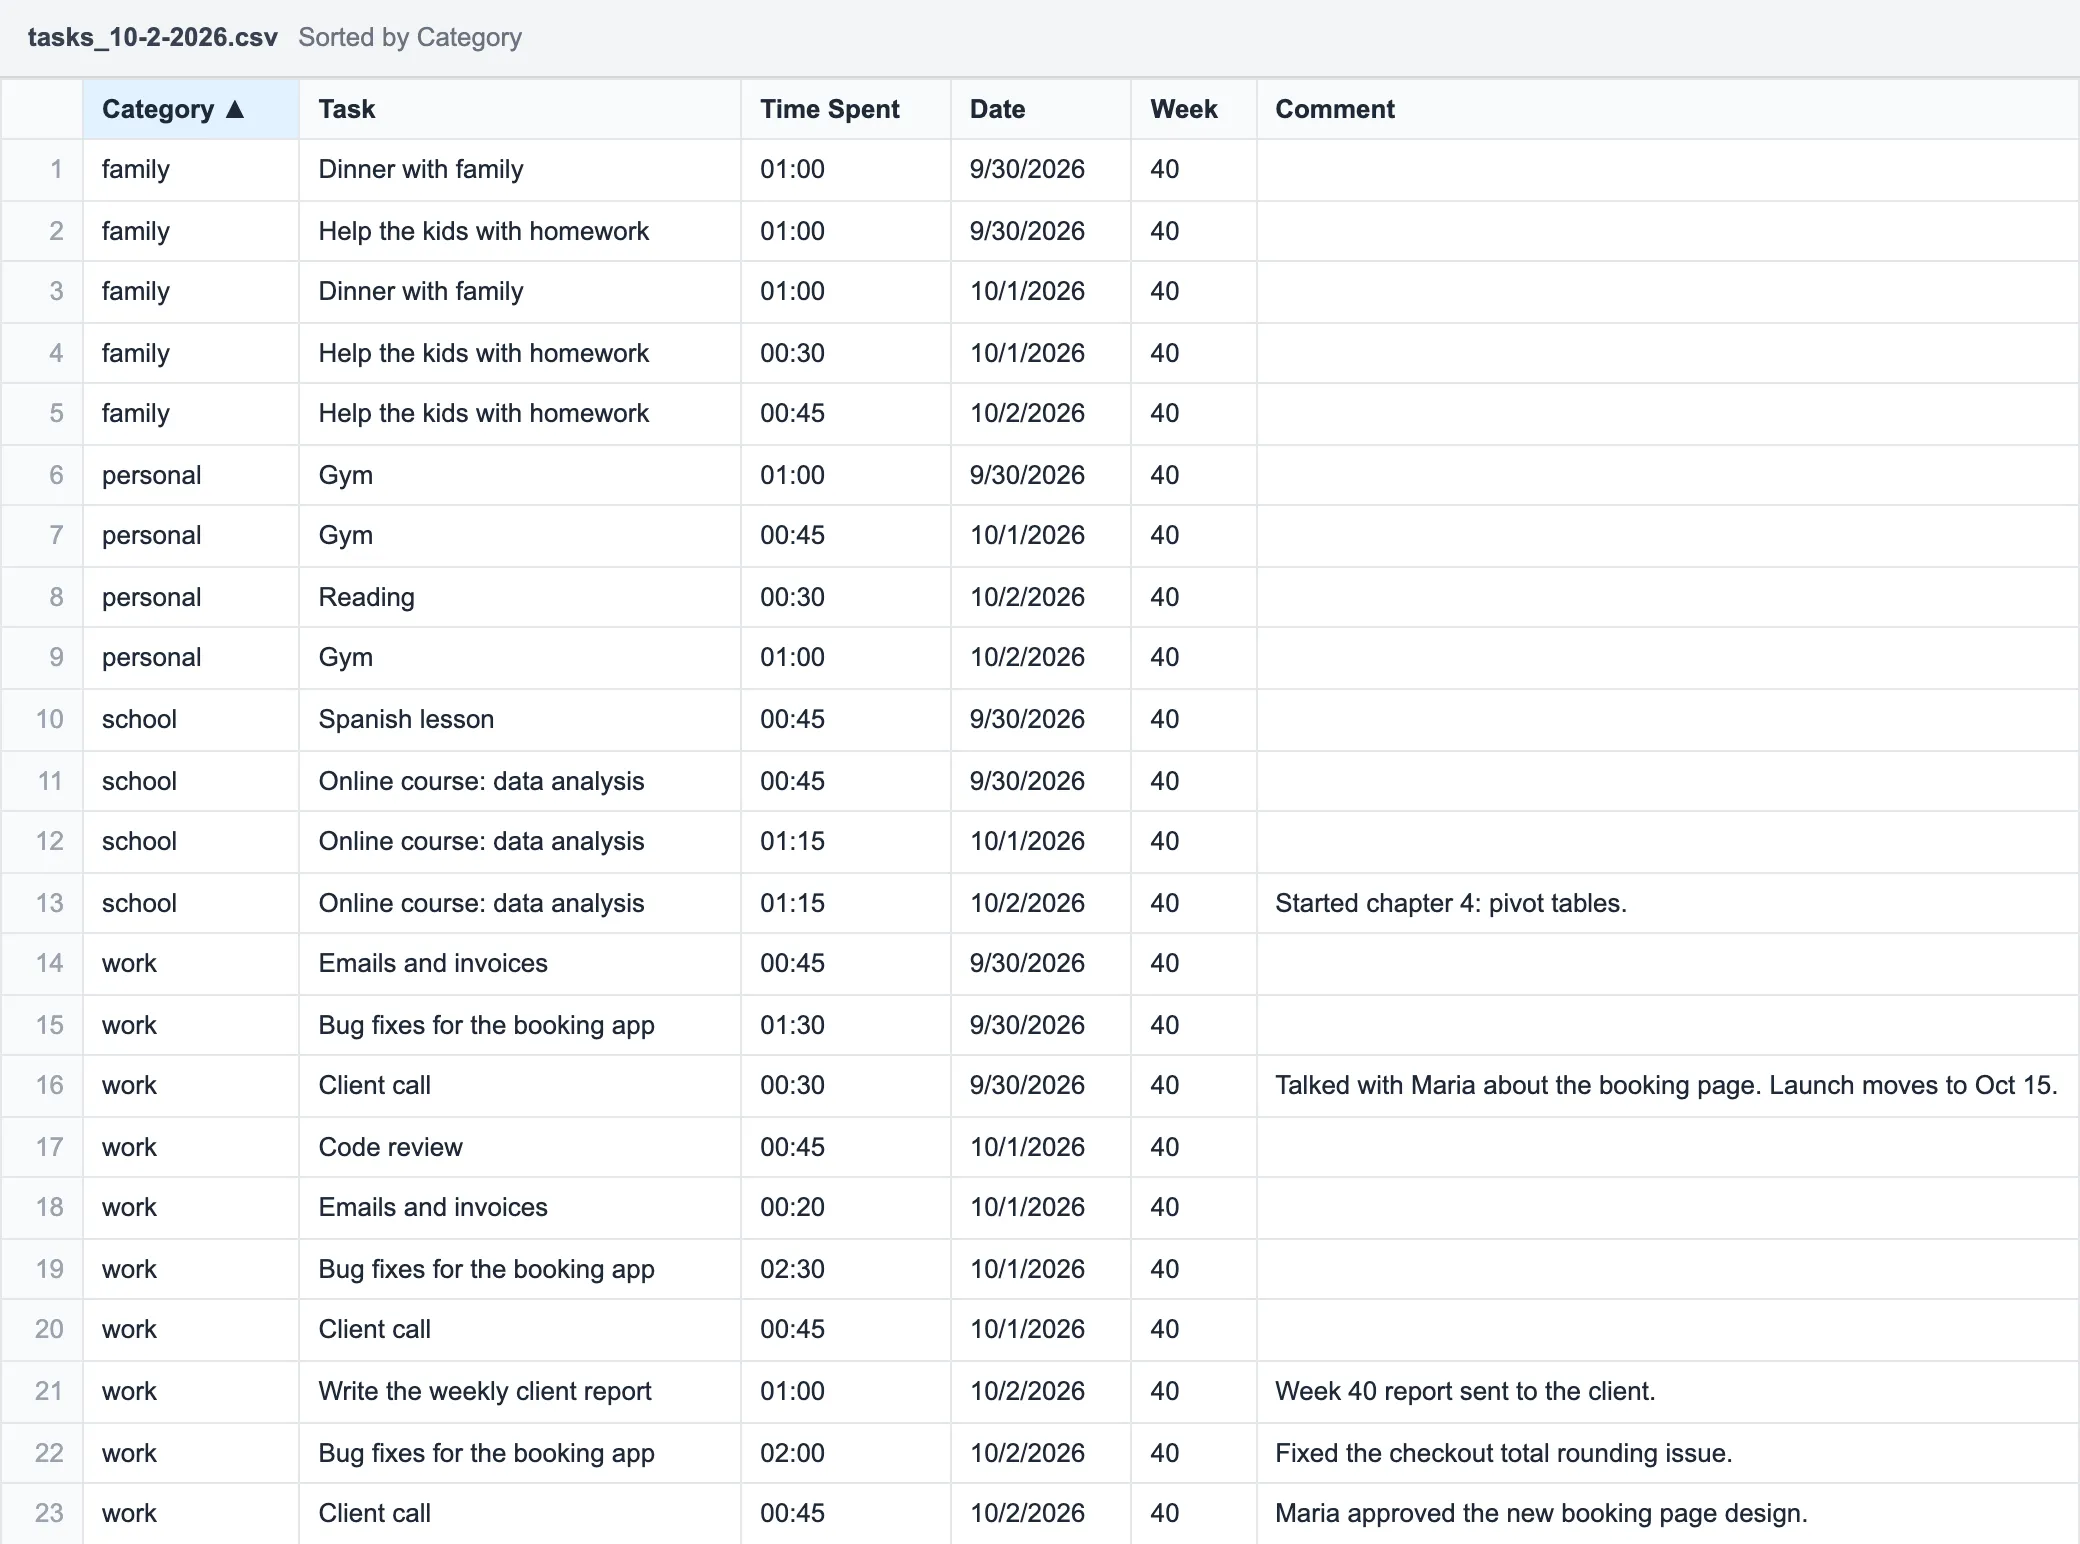
Sorting by category is the step that makes reports easy. Your work hours sit together, and personal tasks move out of the way. Add a total at the bottom, and you have a timesheet.
Time Spent is written as hours and minutes, like 01:30. If a total over 24 hours looks too small, change the cell format. Use Duration in Google Sheets or [h]:mm in Excel.
The CSV also keeps a copy of all your records on your own device. There's no import button, but your history is safe in the file. It's smart to download one every week or so, especially if you use the free guest mode.
Finished tasks in plain text or CSV: which to use
You get two views of your finished work from the same data. The Recorded Tasks text is best for reading and pasting. The CSV is best for sorting, adding up and sharing.
A quick team update can be a pasted block of text. A client report can be a sorted sheet with your notes in it. Either way, you never retype anything.
Example: a weekly or monthly work report in six steps
Here's how a freelancer could make a Friday client update. The same steps work for a monthly report to your manager or a student's study log.
- Log as you go. When you finish a task, add it with its time and category. Use the same name for the same kind of work.
- Add a one-line comment. Write what you did, who it was for, or what comes next.
- Clean up on Friday. Sort the task table by date. Fix typos, wrong times or wrong categories in Edit Task, and log anything you forgot on its real date.
- Check the charts. Switch the Time Report to Week, or keep it on Month for a monthly report. It shows the current week or month, so check it before the period ends. Note the total and the time for each category.
- Copy the text log. Copy the days you need from Recorded Tasks and paste them into your email. Hover over the speech bubbles to pull in details from your notes.
- Attach the details. Download the CSV and open it in Google Sheets or Excel. Filter the Week column by this week's number, or filter by date for a month. Sort by Category, add totals and send it. Your comments are already in it.
The report takes a few minutes because you did the hard part during the week. When your manager asks what you did this month, the hours and the notes are already there.
Mobile friendly from the start
A lot of tasks end away from your desk. IAM Rate works well on a phone. The layout fits small screens, and the four categories wrap into two columns. The Comment button turns into a small icon, so the form stays neat.
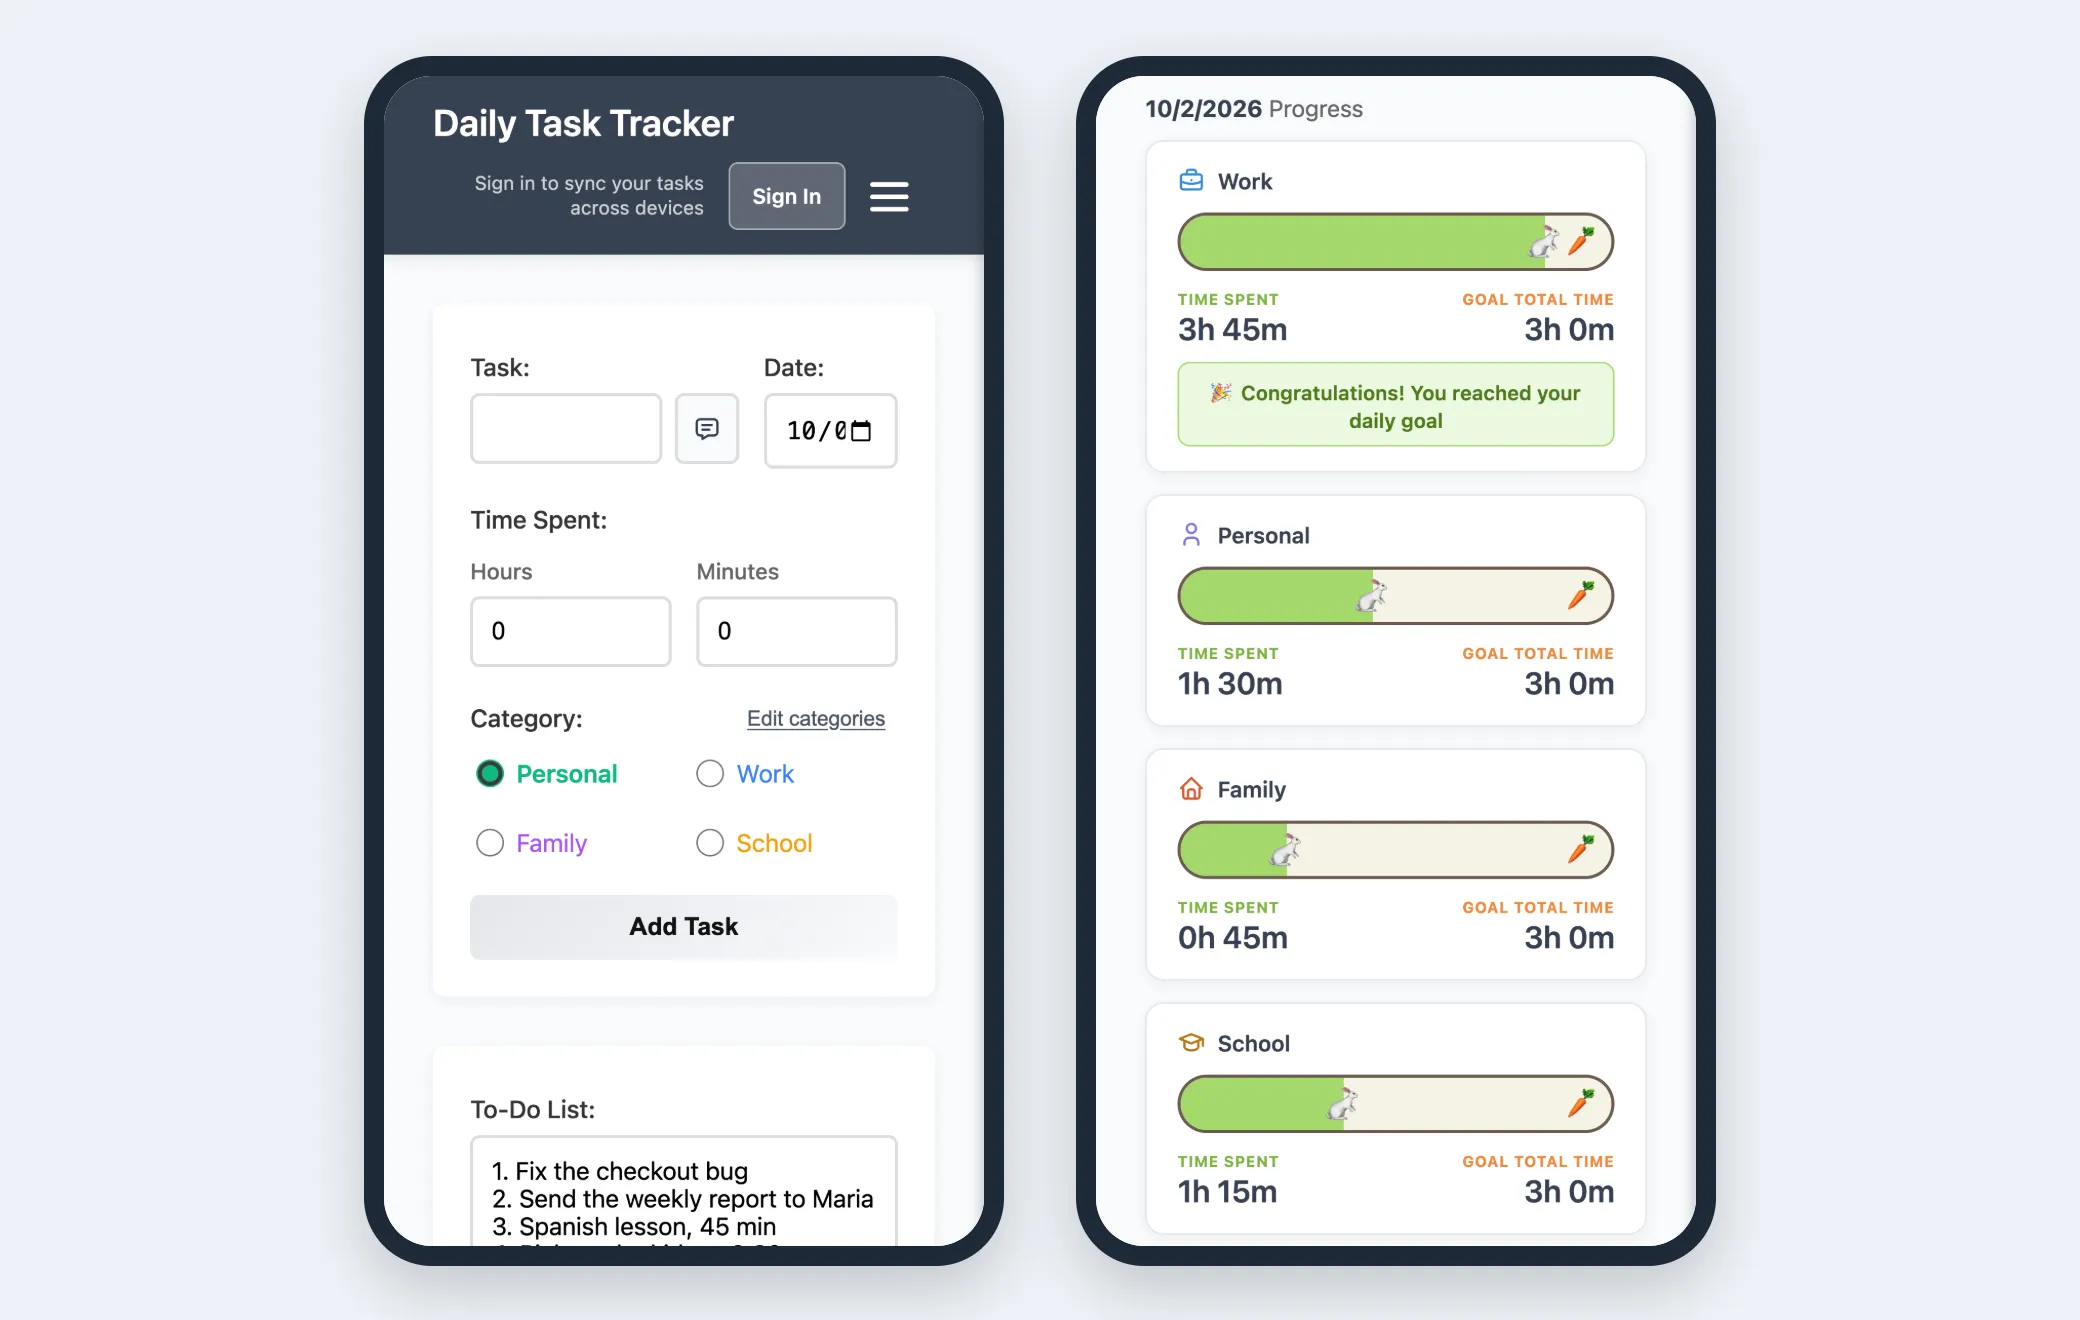
You can log a task right after a meeting, on the bus or between classes. You don't have to wait until you're back at your desk and the details are fuzzy.
Install it as an app from Chrome
You don't need an app store. Open the home page at www.iamrate.com in Chrome, then open the browser menu and choose Install. On a phone, choose Add to Home screen. It then opens from its own Task Tracker icon in its own window, like any other app.
On iPhone, open the site in Safari, tap the Share menu, and choose Add to Home Screen.
When your tracker is one tap away, you're more likely to log tasks when they happen. That's when the details are still fresh.
Easy to use, with nothing to set up
IAM Rate is one page, with a short form and plain words. There's no timer to watch and nothing to set up before your first task. You can start in seconds.
That matters because a tracker only helps if you keep using it. For one person who wants to track a day and write a report, every extra step is a reason to quit. To see who the app fits best, read IAM Rate for freelancers, students and anyone who struggles to stay organized.
Free guest mode or a low-cost subscription
You can use IAM Rate for free as a guest. There's no sign-up and no card to enter, and you get every feature. That means you can test it with a real week of work before you pay anything.
Guest tasks are saved in that browser only. If you clear your browser data, they're gone, so download a CSV now and then.
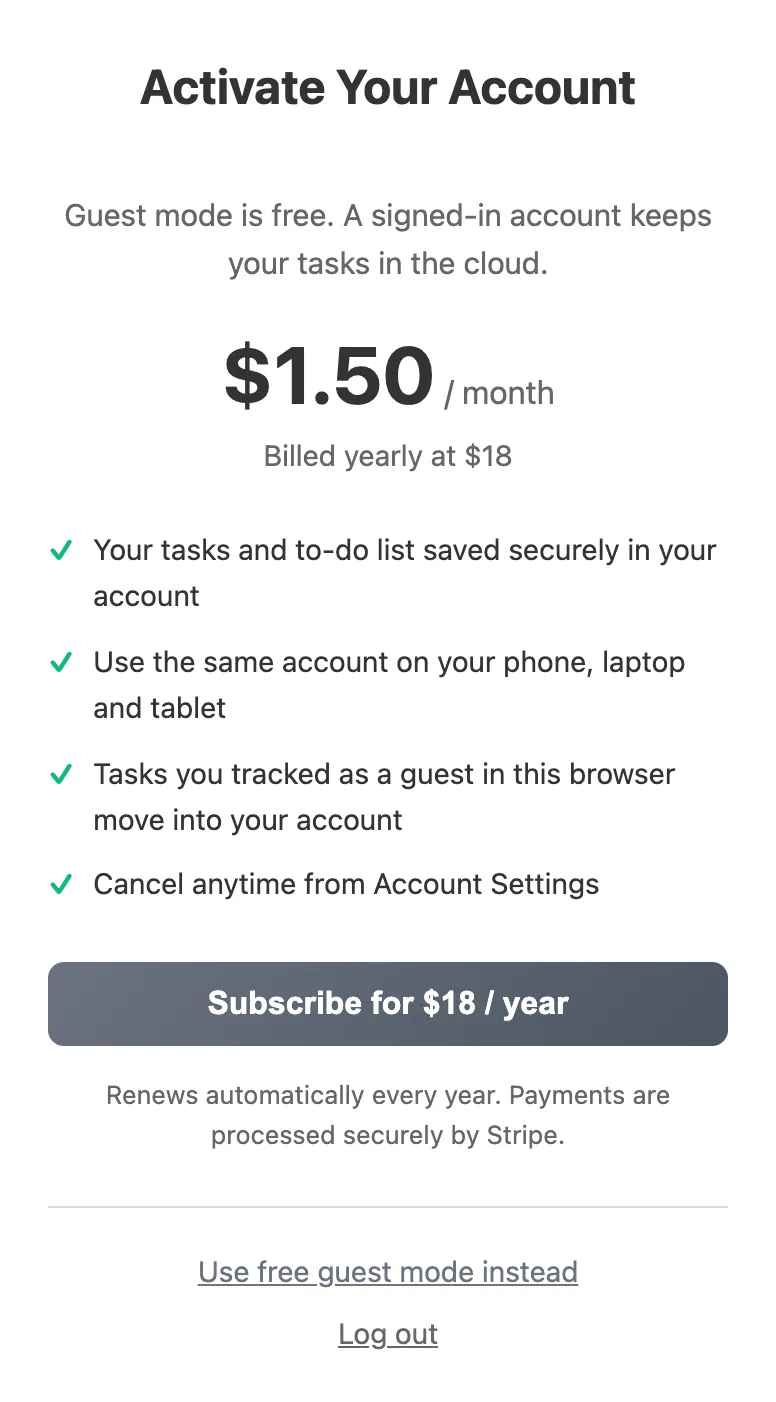
An account costs $1.50 per month, billed yearly at $18. It renews every year, payments are handled by Stripe, and you can cancel anytime from Account Settings.
Use it on all your devices
With an account, your tasks and your to-do list are saved online. Sign in on your phone, laptop and tablet, and you see the same data on each one. Log a task on your phone after a meeting, then build the report on your laptop.
You don't lose anything by starting as a guest. Tasks you logged as a guest in that browser move into your account when you sign in.
Free guest mode vs account at a glance
| What you get | Free guest mode | Account |
|---|---|---|
| Price | Free | $1.50 per month, billed yearly at $18 |
| Sign-up needed | No | Yes |
| Every feature, including comments, charts, rabbits and CSV | Yes | Yes |
| Where your tasks are saved | In this browser only | Online in your account |
| Same tasks on phone, laptop and tablet | No | Yes |
| If you clear browser data | Tasks are removed, so keep a CSV copy | Tasks stay in your account |
| Tasks logged as a guest | Stay in that browser | Move into your account when you sign in |
| Canceling | Nothing to cancel | Anytime from Account Settings |
What stands out when you compare apps
Here is what we think sets IAM Rate apart from other task trackers:
- Comments made for reports. Add a note of up to 500 characters to any task. It shows in the table and goes into the CSV.
- Finished work in more than one format. A plain text log to paste, a sortable table and a CSV you can sort by category, week or date.
- Easy cleanup. Edit any field of any task, rename categories and log tasks for past days, so your report stays accurate.
- Clear charts. Today, Week and Month views, a running total of your hours and a Task Frequency cloud.
- Motivation you can see. Rabbit cards with a 3-hour daily goal for each category.
- No timer and no setup. One page and a short form. No projects, clients or tags to create.
- Made for phones too. The layout fits small screens, and you can install it from Chrome without an app store.
- Fair pricing. Every feature is free as a guest. Using it on all your devices costs $18 a year.
The best way to judge is to try it with a real day of work. Open the app, log what you've done so far today, and add a comment to one task. You don't need an account. When you want your tasks on every device, you can create an account.
Put this into practice today
Daily Task Tracker is a free to-do list and time tracker. You don't need an account to start. Your tasks save right in your browser.
Go to App